Below 800 GDD50
1.5% Too early
351 ZCTAs
National field report October 16, 2026
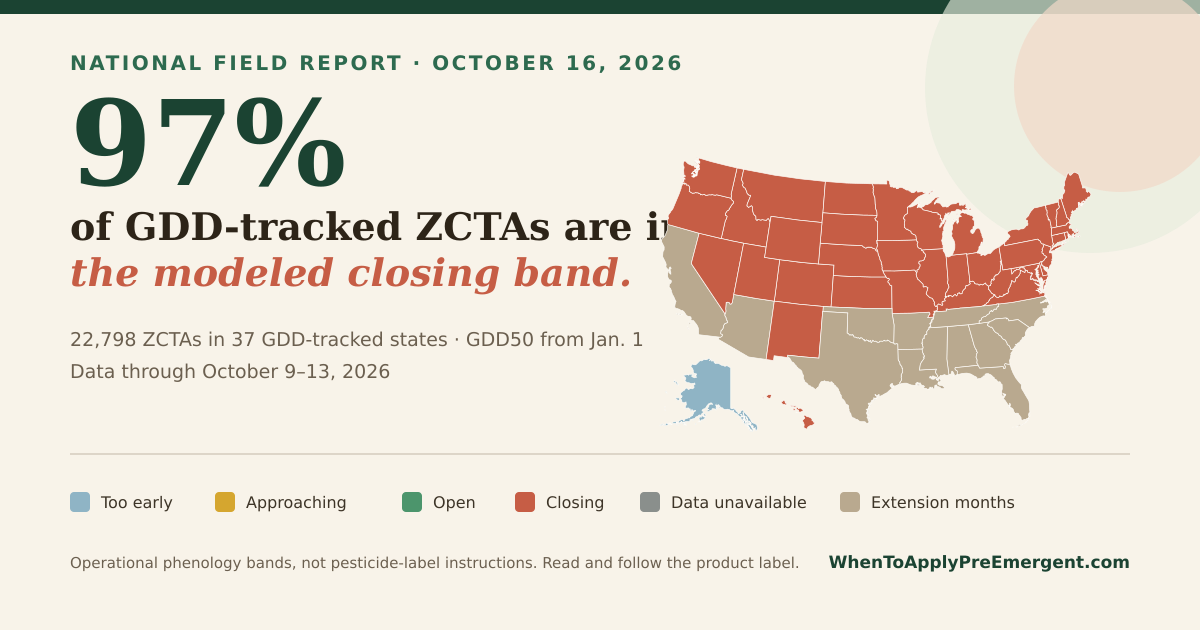
The latest verified release places 22,119 of 22,798 covered ZCTAs in GDD-tracked states in the modeled preventive window closing band. The report rebuilds daily from the same citable GDD release used by the public data product. Alabama, Arizona, Arkansas, California, Florida, Georgia, Louisiana, Mississippi, North Carolina, Oklahoma, South Carolina, Tennessee, and Texas follow published Extension months instead and are listed separately.
01
The national pulse
351 ZCTAs
134 ZCTAs
194 ZCTAs
22,119 ZCTAs
The midpoint covered ZCTA is preventive window closing.
The 10th–90th percentile range shows the current national geographic spread.
Used a fresher alternate station in public release 2026-10-16.
02
Reusable national image
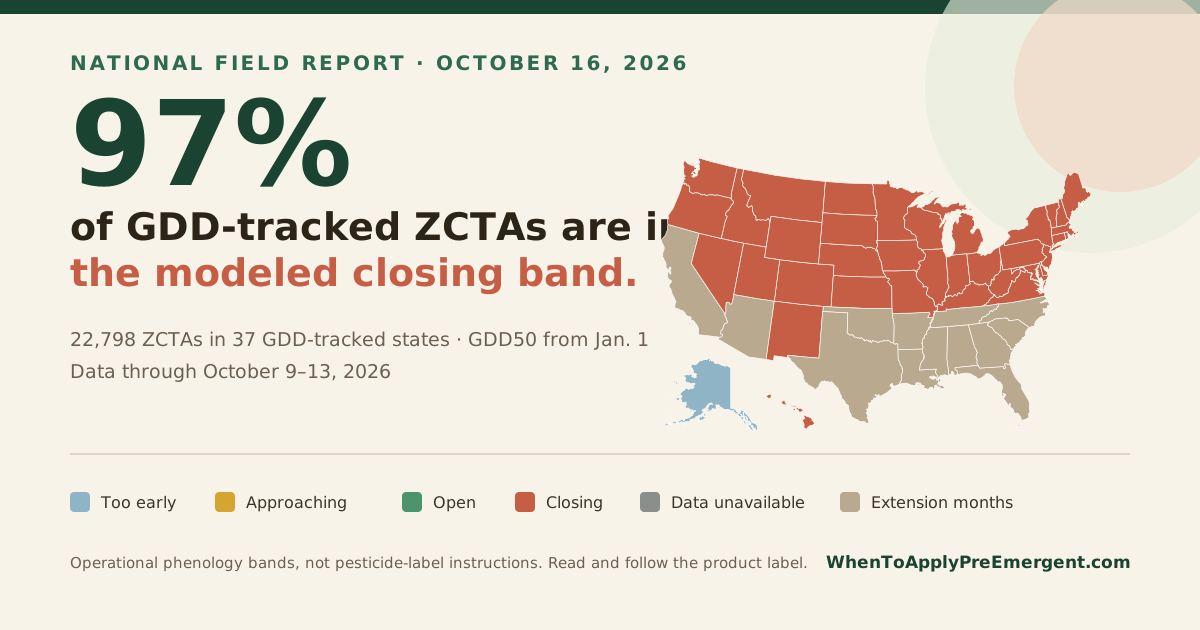
03
Twelve states to watch
Closing
Median 2,765.9 GDD50; 0% open, 0% approaching, and 100% closing across 992 covered ZCTAs.
Open Michigan's ZIP toolClosing
Median 3,384.2 GDD50; 0% open, 0% approaching, and 100% closing across 1,233 covered ZCTAs.
Open Ohio's ZIP toolClosing
Median 2,738.3 GDD50; 0% open, 0% approaching, and 100% closing across 783 covered ZCTAs.
Open Wisconsin's ZIP toolClosing
Median 2,809.1 GDD50; 0% open, 0.5% approaching, and 99.5% closing across 880 covered ZCTAs.
Open Minnesota's ZIP toolClosing
Median 2,679.8 GDD50; 0% open, 0% approaching, and 100% closing across 1,826 covered ZCTAs.
Open New York's ZIP toolClosing
Median 2,687.6 GDD50; 0% open, 0% approaching, and 100% closing across 539 covered ZCTAs.
Open Massachusetts's ZIP toolClosing
Median 2,961.9 GDD50; 0% open, 0% approaching, and 100% closing across 288 covered ZCTAs.
Open Connecticut's ZIP toolClosing
Median 2,163.4 GDD50; 0% open, 0% approaching, and 100% closing across 427 covered ZCTAs.
Open Maine's ZIP toolClosing
Median 2,488.8 GDD50; 0% open, 0% approaching, and 99% closing across 389 covered ZCTAs.
Open North Dakota's ZIP toolClosing
Median 2,313.8 GDD50; 5.1% open, 2.1% approaching, and 92.1% closing across 428 covered ZCTAs.
Open Oregon's ZIP toolClosing
Median 2,091.1 GDD50; 6.8% open, 1.8% approaching, and 88.8% closing across 605 covered ZCTAs.
Open Washington's ZIP toolClosing
Median 3,350 GDD50; 2.3% open, 5.9% approaching, and 83.7% closing across 528 covered ZCTAs.
Open Colorado's ZIP toolRead this before treating
This report maps this site's operational 800–1,300 GDD50 bands. Those cut points are a broad planning cue tied most directly to Japanese beetle seasonal development—not a universal, research-validated application threshold for every grub species, active ingredient, lawn, or state.
Before using any pesticide, read and follow the current label on your container. It controls the allowed site, target pest, timing, rate, watering, application frequency, setbacks, and safety precautions. Product registrations and state restrictions can change. Confirm active grubs and consult local Extension guidance when species or timing is uncertain.
EPA: how to read legally enforceable pesticide labels04
All-state summary
Status is assigned from each state's median ZCTA GDD50. The four count columns show the underlying within-state distribution so a median does not masquerade as a uniform state.
| State | Median GDD50 | 10th–90th pct. | Modeled status | Too early | Approaching | Open | Closing | Available ZCTAs |
|---|---|---|---|---|---|---|---|---|
| Alabama AL | 5,902.6 | 5,153.4–6,460.9 | Extension months | — | — | — | — | 656 |
| Alaska AK | 450.3 | 89.5–820.5 | Too early | 217 | 26 | 2 | 0 | 245 |
| Arizona AZ | 7,633.3 | 3,032.7–9,239.4 | Extension months | — | — | — | — | 416 |
| Arkansas AR | 5,811.4 | 5,250.6–6,260 | Extension months | — | — | — | — | 614 |
| California CA | 4,907.2 | 2,924.7–5,932.8 | Extension months | — | — | — | — | 1,803 |
| Colorado CO | 3,350 | 882.7–4,164.8 | Closing | 43 | 31 | 12 | 442 | 528 |
| Connecticut CT | 2,961.9 | 2,468–3,188.7 | Closing | 0 | 0 | 0 | 288 | 288 |
| Delaware DE | 4,163 | 4,027.5–4,288 | Closing | 0 | 0 | 0 | 68 | 68 |
| Florida FL | 7,454 | 6,538.6–8,169.8 | Extension months | — | — | — | — | 1,013 |
| Georgia GA | 5,747.3 | 5,178.9–6,359 | Extension months | — | — | — | — | 751 |
| Hawaii HI | 7,331.1 | 2,369.6–7,927.4 | Closing | 2 | 0 | 0 | 95 | 97 |
| Idaho ID | 2,369.2 | 1,240.9–3,341.3 | Closing | 2 | 12 | 22 | 244 | 280 |
| Illinois IL | 3,817.5 | 3,266.7–4,773.5 | Closing | 0 | 0 | 0 | 1,396 | 1,396 |
| Indiana IN | 3,732.5 | 3,223.3–4,594.9 | Closing | 0 | 0 | 0 | 807 | 807 |
| Iowa IA | 3,459.1 | 3,041.5–3,926.4 | Closing | 0 | 0 | 0 | 970 | 970 |
| Kansas KS | 4,731.3 | 4,200.3–5,407.9 | Closing | 0 | 0 | 0 | 704 | 704 |
| Kentucky KY | 4,337.9 | 4,032.6–5,002.9 | Closing | 0 | 0 | 0 | 779 | 779 |
| Louisiana LA | 6,743.5 | 6,348.2–7,039.7 | Extension months | — | — | — | — | 539 |
| Maine ME | 2,163.4 | 1,656.4–2,524.7 | Closing | 0 | 0 | 0 | 427 | 427 |
| Maryland MD | 4,135.4 | 3,718.6–4,619.6 | Closing | 0 | 0 | 0 | 477 | 477 |
| Massachusetts MA | 2,687.6 | 2,321.2–3,187.3 | Closing | 0 | 0 | 0 | 539 | 539 |
| Michigan MI | 2,765.9 | 1,957.8–3,197.8 | Closing | 0 | 0 | 0 | 992 | 992 |
| Minnesota MN | 2,809.1 | 2,053.6–3,161.9 | Closing | 0 | 4 | 0 | 876 | 880 |
| Mississippi MS | 6,254.4 | 5,759.6–6,649.6 | Extension months | — | — | — | — | 427 |
| Missouri MO | 4,682.9 | 4,138.5–5,183.8 | Closing | 0 | 0 | 0 | 1,035 | 1,035 |
| Montana MT | 2,081.7 | 922.6–2,863.9 | Closing | 26 | 18 | 32 | 293 | 369 |
| Nebraska NE | 3,783.3 | 3,320.8–4,169 | Closing | 0 | 0 | 0 | 586 | 586 |
| Nevada NV | 3,855.1 | 1,435–8,073.8 | Closing | 3 | 0 | 9 | 168 | 180 |
| New Hampshire NH | 2,397.6 | 1,829–2,658.4 | Closing | 2 | 0 | 0 | 244 | 246 |
| New Jersey NJ | 3,748.2 | 3,200.4–4,003.1 | Closing | 0 | 0 | 0 | 598 | 598 |
| New Mexico NM | 3,475.2 | 1,448.2–5,780.1 | Closing | 14 | 2 | 16 | 341 | 373 |
| New York NY | 2,679.8 | 2,091.9–3,731.3 | Closing | 0 | 0 | 0 | 1,826 | 1,826 |
| North Carolina NC | 4,955.8 | 3,807.5–5,462.2 | Extension months | — | — | — | — | 853 |
| North Dakota ND | 2,488.8 | 2,139.5–2,855.3 | Closing | 4 | 0 | 0 | 385 | 389 |
| Ohio OH | 3,384.2 | 3,051.4–3,944.5 | Closing | 0 | 0 | 0 | 1,233 | 1,233 |
| Oklahoma OK | 6,051.7 | 5,370.7–6,369.5 | Extension months | — | — | — | — | 644 |
| Oregon OR | 2,313.8 | 1,399.9–3,035.8 | Closing | 3 | 9 | 22 | 394 | 428 |
| Pennsylvania PA | 3,160.2 | 2,467.2–3,828 | Closing | 0 | 0 | 0 | 1,833 | 1,833 |
| Rhode Island RI | 3,150.4 | 2,476.7–3,150.4 | Closing | 0 | 0 | 0 | 81 | 81 |
| South Carolina SC | 5,439.6 | 4,871–6,153.3 | Extension months | — | — | — | — | 424 |
| South Dakota SD | 3,113.3 | 2,607.6–3,490.7 | Closing | 0 | 0 | 1 | 374 | 375 |
| Tennessee TN | 5,076 | 4,265.7–5,769.3 | Extension months | — | — | — | — | 638 |
| Texas TX | 7,010.2 | 6,144.2–7,656.1 | Extension months | — | — | — | — | 1,989 |
| Utah UT | 2,828.9 | 1,271.7–4,393.2 | Closing | 7 | 8 | 17 | 267 | 299 |
| Vermont VT | 2,039 | 1,616.7–2,520.2 | Closing | 0 | 3 | 0 | 262 | 265 |
| Virginia VA | 4,301.8 | 3,479.5–4,894.2 | Closing | 0 | 0 | 0 | 903 | 903 |
| Washington WA | 2,091.1 | 1,287.2–2,910.8 | Closing | 16 | 11 | 41 | 537 | 605 |
| West Virginia WV | 3,658.2 | 2,723.1–4,194.7 | Closing | 0 | 0 | 0 | 738 | 738 |
| Wisconsin WI | 2,738.3 | 2,209.5–3,090.3 | Closing | 0 | 0 | 0 | 783 | 783 |
| Wyoming WY | 2,459.1 | 950.3–3,119.9 | Closing | 12 | 10 | 20 | 134 | 176 |
Need the values in a newsroom or analysis workflow? Download the CSV with dates, counts, percentiles, and state-tool URLs.
05
Method & uncertainty
The report derives every claim from public release
2026-10-16.
It contains 33,642 nationwide ZCTA rows; this
50-state report includes 33,565 fresh values.
The source release keeps 20 unavailable
rows explicit instead of substituting stale station data.
For each day from January 1, daily GDD50 is
max(0, (Tmax + Tmin) / 2 − 50°F). Daily values are summed. This is an
air-temperature-derived index from NOAA stations, not an on-lawn soil-temperature reading.
Each ZCTA can consider up to 8 nearby candidates. The pipeline uses the nearest station with sufficiently fresh Tmax/Tmin data and falls back when a closer station is stale or incomplete. 7,675 reported ZCTAs used a fallback.
Census ZCTAs are assigned to the state containing their largest land-area share. State status comes from the median GDD50; the table also reports the 10th–90th percentile range and every ZCTA-level band count.
The GDD bands come from northern Japanese beetle timing. In Alabama, Arizona, Arkansas, California, Florida, Georgia, Louisiana, Mississippi, North Carolina, Oklahoma, South Carolina, Tennessee, and Texas, heat from January 1 builds long before beetles fly, so the site's ZIP results follow published university Extension months instead. Those states keep their GDD50 percentiles for reference and are left out of the national band counts.
Elevation, coast and lake effects, urban heat, shade, snow cover, irrigation, soil moisture and texture, turf condition, beetle species, and local establishment can shift biology. Recent GHCN-Daily records may lag and can later be replaced by archive-quality values. A station-based ZCTA estimate is a planning proxy, not a measurement of an individual lawn.
Read the full site methodology06
Preventive is not curative
Preventive
Preventive active ingredients do not share one national date. Michigan State's 2026 guidance places chlorantraniliprole earlier than imidacloprid examples. The modeled band should prompt a label and local-guidance check, not a brand-agnostic application order.
Curative
Crossing 1,300 GDD50 does not automatically call for trichlorfon or another rescue treatment. Confirm live grubs, species or stage, and actual injury. Late rescue control can be partial once grubs are large.
07
Primary sources
From national signal to local check
This stable report URL follows the latest verified daily release. The ZIP tool shows the current serving value, observation date, and station distance for a specific location.
Check your ZIP's live grub timing